

H5 Network has developed a solution that provides to the network administrators a business visibility via simple intuitive and complete views. We rely on a proven and standardized model which is easy to implement and with a low TCO (Total Cost of Ownership).
NetFlow & sFlow
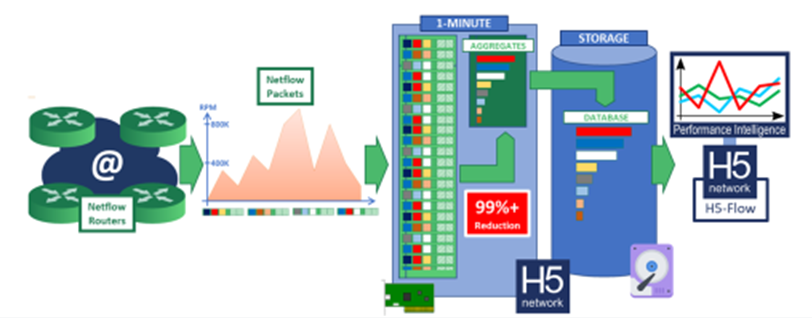
The H5-FLOW unit main feature is the real-time collection of the NetFlow and/or sFlow records of the network. Many types of active devices have the capacity to extract specific information from the application network flow such as the packets number and bytes transmitted by the server, client and application. It is also possible to configure the network devices to format and send this information to the H5-FLOW appliance in accordance with two industry standards :
-NetFlow
-sFlow
Simple, intuitive and complete
The H5-FLOW appliance collects these records, stores and aggregates them in a database on-the-fly. The information network flow can be viewed and used through performance indicators at all times by the network teams via :
-Dashboards
-Web reports
-Alarms generation when the threshold is overrun
All-in-one solution
Based on an all-in-one upgradable architecture, H5-FLOW is produced on same standard as H5-Appliance: it is a fully autonomous plug-and-play system.
H5-FLOW range
The range of H5-FLOW appliances allows network administrators to maintain 100% network visibility while the monitored traffic is constantly increasing. H5 Network software works identically on all appliances. The model to be selected depends on the number of simultaneous flows : from 50 000 to 500 000 flows.
-IT Management
-IT Operations
-Support
-Business (Marketing, Finances, RH, & +)
H5-DOCK
H5-DOCK Java client is the user interface designed for network engineers/IT Operations. Directly downloaded from the appliance, H5-DOCK remotely connects to its database and dynamically displays all metrics in relation to all network objects that are detected or configured on your environment. A choice of tables and graphs allows deep exploration, detailed and complete analysis of these data.
Multiple views
H5-DOCK displays multiple views exploring network flows coming across for numerous geographical areas and various time intervals. Powerful data analysis’ tools such as the time zooming and deep-drilling enable to diagnose isolated traffic abnormal behaviors among thousands of network conversations.
Captures
From H5-DOCK interface, users run on-demand filtered captures, configure threshold alerts and dashboards reports meeting their specific needs.
Dashboards
Business dashboards enable the helpdesk and engineers to access with one click predefined and preselected statistics screen, displaying all the data’s that is essential to highlight and clarify a particular business context.
Our system is delivered with a set of factory-configured business dashboards. Available widgets allow to design your own dashboards to meet your context, function and needs. Our Professional Services can of course assist and support you in customized reports and dashboards configuration and creation.
Examples :
-WAN performance (load, who does what)
-Traffic matrix of the Datacenter entry
-TOP 5 sites of worst WAN performances, and more...
H5-PERFORMANCE REPORTER
Our web reporting portal allows users (managers, engineers, business, helpdesk, and more) to access at all times all available reports. In addition, SNMP alerts or emails grant the Helpdesk/Support to receive an instantaneous and immediate notification when incident or abnormal situation occurs.
Simple, comprehensive and intuitive
H5-Performance Reporter is our web interface solutions: it provides simple, comprehensive and intuitive reports with an ergonomic view and instantaneous dashboards.
Common to all actors
H5-Performance Reporter interface allows all business audiences a tailored tool adapted to their needs. Additionally of facilitating communication within the company, H5-Performance Reporter enables you with a global and high level IT views, to drive deep analysis on incidents root-cause and promptly direct actions requests towards relevant teams: you evolve into a pro-active attitude and act before situation becomes critical.
Complete view of your network and of your applications
H5-Performance Reporter provides an instantaneous and complete view of your whole network and your applications. Maintaining IT performance and availability is essential for your company operations. A global visibility is a must for a good management.
Built-in and customized reports
This interface provides built-in reports and customized reports in which you organize your own menu of folders, subfolders or reports.
Ergonomic and express
Its ergonomic and easy-to-use functions allow everyone (in respect of their profile configuration and level authorization granted by the solution administrator) to create, modify and analyze reports.
H5 Network has partnered with open source monitoring data company Zabbix. Zabbix can easily be integrated to our solutions which means Zabbix users can receive and read data from our collector solution (H5-FLOW) and IP application monitoring solution (H5-Application).
Network performance data is dynamically extracted using REST API and loaded in Zabbix database.
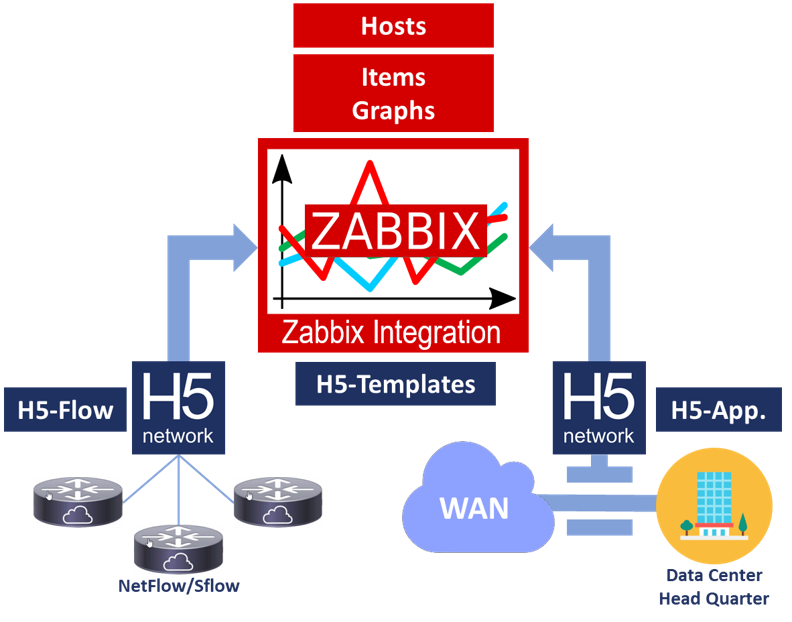
H5-FLOW | NetFlow collector
H5-FLOW offers to Zabbix users a high performance solution with diverse capablities:
- High performance NetFlow Engine
- Aggregated data to Zabbix through full REST API
- Discovery templates and dashboards
- Illimited interfaces: 50K to 500K flows
.jpg)